 Administering the Personalization Portal
The Personalization Portal is the user interface for accessing Product Recommendations, Email Product Recommendations, Email Content Recommendations, Triggered Messages, and Promoted content. Features include automatic product recommendations online and through email.
You can see how a site is configured, but you must contact Episerver Support to modify Personalization site attributes. Personalization Portal is available only if you have Product Recommendations or Email Product Recommendations installed on your site.
You can do the following functions with the Admin view.
- Site management. You can see how a site is configured but can modify site attributes only through contacting Episerver Support. See Managing your site.
- User Management. Using a user's CUID or IP address, you can view a snapshot of current user activity. See Viewing session data.
Managing your site
Site management lets you perform the following functions.
- View feed status
- View trigger settings
- View Personalized Search & Navigation settings
- View site settings
- View site groups
- Access site tokens
Viewing feed status
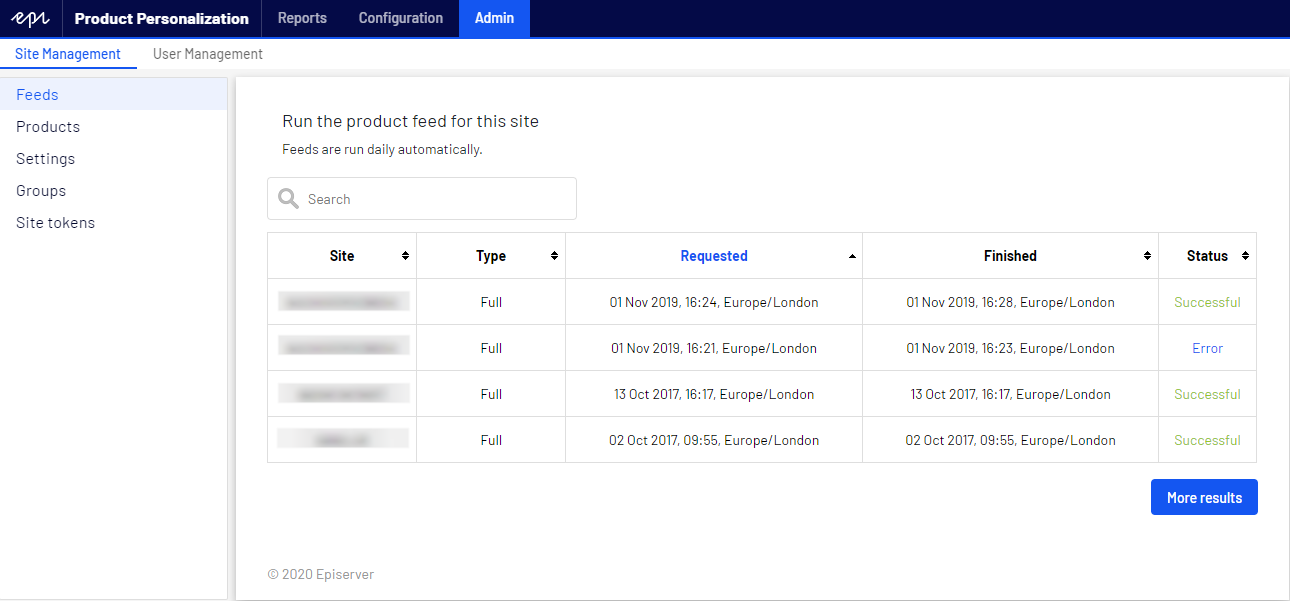
You can view the status of the import of your site’s product catalog feeds. The status is either Successful or Error. If you get an error status, click Error for more details about the error.
Feeds are automatically imported daily into the Episerver Personalization system, but you can contact Episerver Support to have a feed processed manually.
Viewing trigger settings
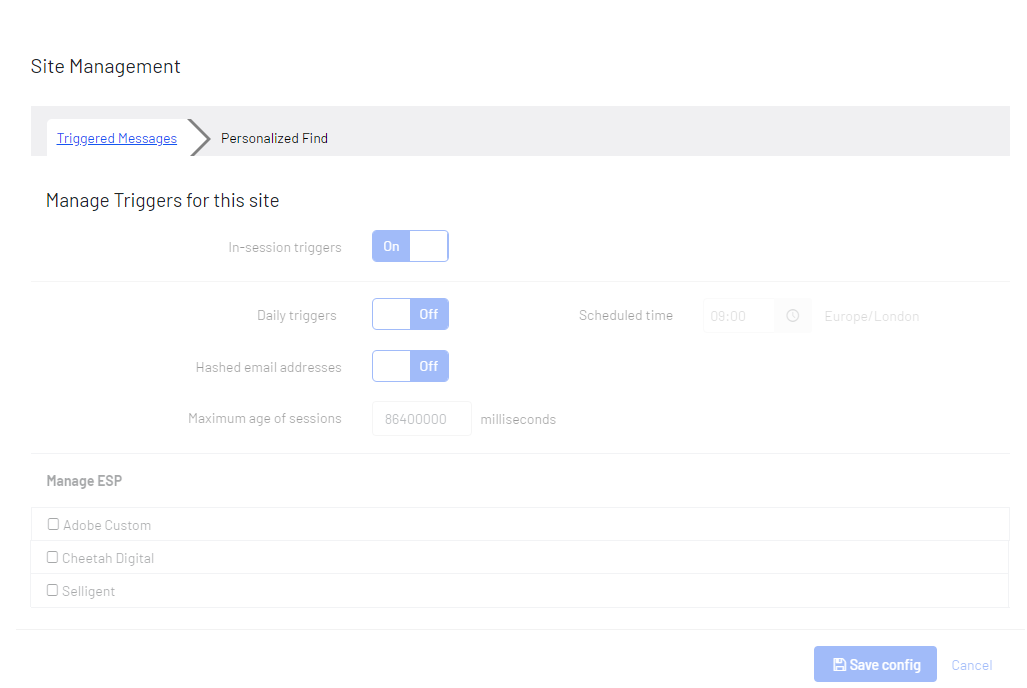
The Manage Triggers for this site view shows trigger settings. Contact Episerver Support if you need to change the settings.
- In-session triggers. Shows whether triggers are enabled.
- Daily triggers. Shows whether daily triggers are enabled.
- Scheduled time. Shows the time when daily triggers go into effect.
- Hashed email address. Shows whether hashed email addresses can be viewed.
- Maximum age of sessions. Shows the number of milliseconds that a session can exist before it ends or becomes a new section.
- Save config. Save the specified settings.
- Cancel. Dismiss changes and return to the previous settings.
Viewing Personalized Search & Navigation settings
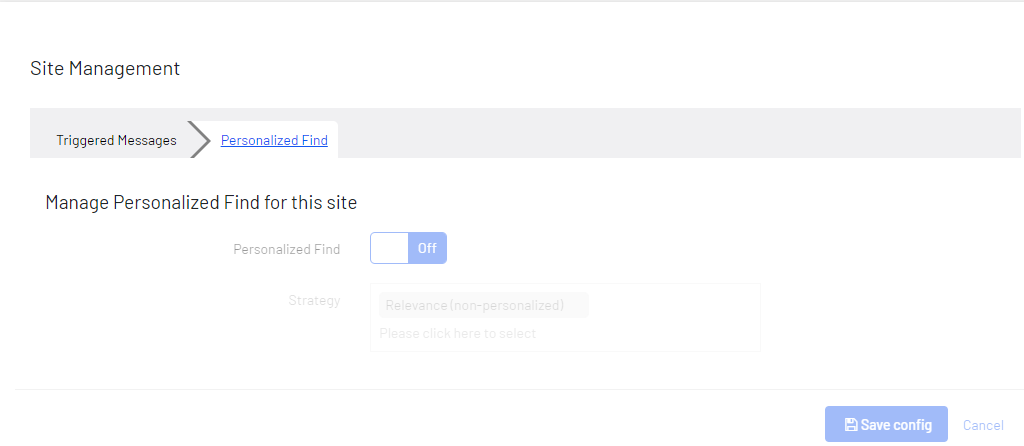
The Manage Personalized Find for this site view shows the strategy for Personalized Search & Navigation (formerly Personalized Find). Contact Episerver Support if you need to change the settings.
- Personalized Find. Indicates whether Personalized Search & Navigation is enabled.
- Strategy. Shows the strategy that is select for Personalized Search & Navigation. If there are more than one strategy, you can select another strategy though Episerver Support.
- Save config. Saves the specified settings.
- Cancel. Dismisses changes and return to the previous settings.
Viewing site settings
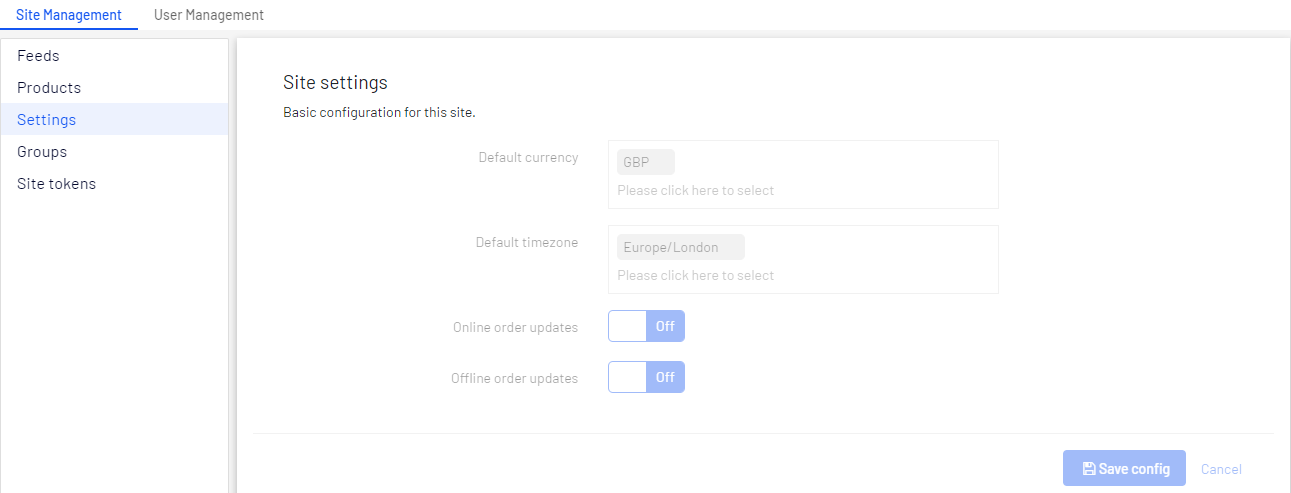
The Site settings view shows the following site attributes. Contact Episerver Support if you need to change the settings.
- Default currency. Shows the currency for your site.
- Default timezone. Shows the timezone for your site.
- Online order updates. Shows whether online order updates are accepted. If this is Off and a customer wants to add something to their online order, the customer will have to make a separate online order; if On, the customer can make changes to their online order.
- Offline order updates. Shows whether offline order updates are accepted. If this is Off and a customer wants to add something to their in-store order, the customer will have to make a separate in-store order; if On, the customer can make changes to their in-store order.
- Save Config. Saves the specified settings.
- Cancel. Dismisses changes and return to the previous settings.
Viewing your site groups
The Groups view shows groups that exist for client sites. Episerver Support can modify the following.
- Create new group. Contact Episerver if you need a new group.
- Edit. Click to modify an existing group.
- Delete. Click to remove the group from the site.
- Sort. You can sort the group attribute columns by clicking the headings.
- Search. Enter the name of a group to find it in the list. Partial names are allowed.

Accessing site tokens
For native clients, the Site tokens view shows the values of your tokens. The Site admin token is necessary when embedding the Personalization Portal in the Episerverglobal navigation; theclient tokensare what you provide in the tracking request. See clientToken in the Common Elements topic on the Episerver World site.

Viewing session data
You can view a user’s session activity on a site using their CUIDStands for "customer user ID" or you can view your own session activity by using your CUID or your IP address. The Session viewer lets you verify that tracking is being sent to the Personalization servers and that recommendations are being returned, with user interactions being tracked correctly. See Tracking and Recommendations on Episerver World for information about how to use the Session viewer after you set it up, and what you should look for when you debug your site.
To view a user's session activity in the Personalization Portal:
- Go to Admin > User Management > Session viewer.
- Enter the CUID into the CUID field and click Find session.
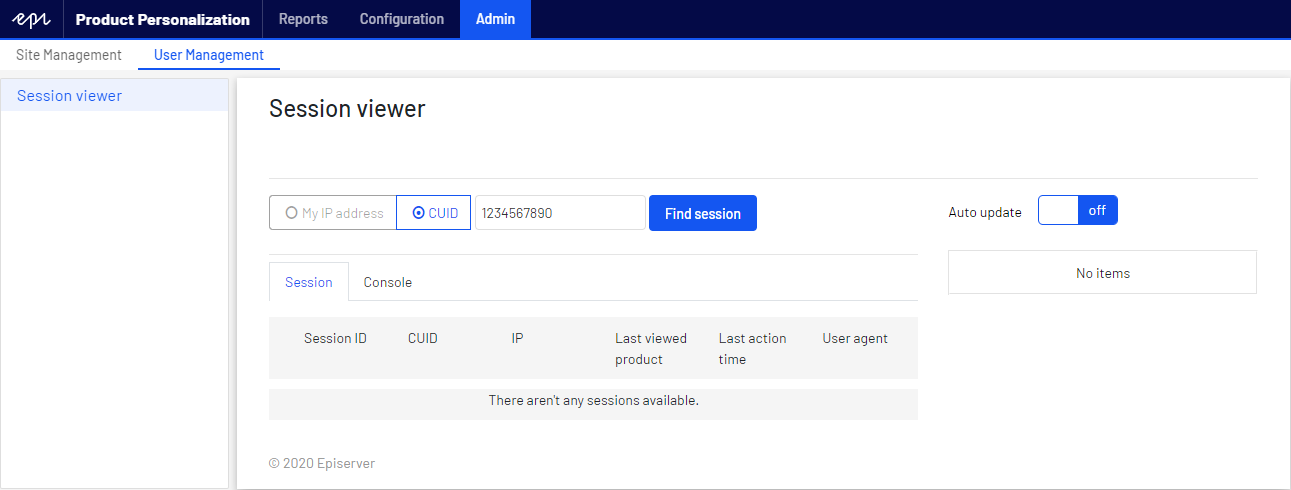
To find your CUID:
- Go to your website.
- Press F12. DevTools menu appears.
- In Chrome, click Application. In Edge or Firefox, click Storage.
- Open the Cookies drop-down list and select the domain for your website.
- In the table, for native clientsClients that use the Episerver platform (such as the CMS with Content Recommendations or Commerce with Product Recommendations or Email Product Recommendations)., find the value of epi_RecommendationsTrackingUserId cookie, or for standalone clientsClients that use non-Episerver platforms (for example, Magento or Hybris) with Product Recommendations, Email Product Recommendations, or other Episerver solutions. find the value of the peerius_user cookie, and copy the CUID number ('cuid=1234567890|xxx_xxxxxxxxxxxxxxxxxxxxxxxxxxx_xxxxxxxxxxxxxx').
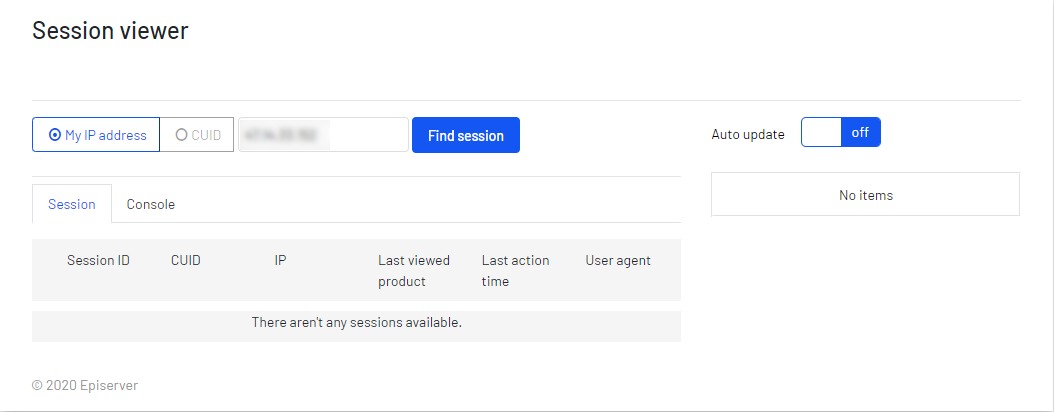
You also can enter your IP address to view your activity.
If your CUID and session are active, you should see an entry under the session tab that will match your session and CUID values (as shown in the following image).
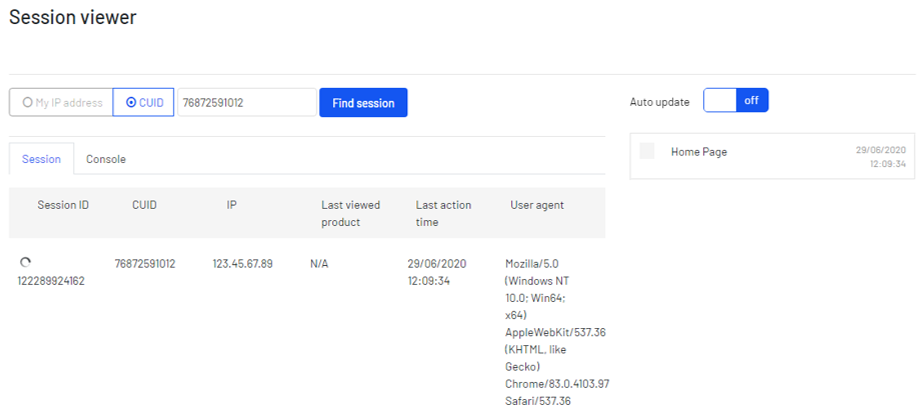
If no sessions are shown, try refreshing the page on the site being tested, or navigate to some other page on your site and try again.
Clicking on the area that contains the session information activates a list of tracking history on the right-hand side of the page for that user/session. The rows include information about the page type being tracked and the timestamp of the request, which can help to find specific requests when debugging issues. The rows are ordered from top to bottom by most recent to oldest requests. New requests are added to the top of the stack.
Clicking on a row on the right-hand side opens the Console tab, containing more detail about the page. This is divided into the following sections:
- Request. Contains information about the page such as URL and timestamp. Most importantly, this tab shows the JSONJavaScript Object Notation (JSON) is a lightweight data-interchange format. It is easy for humans to read and write. It is easy for machines to parse and generate. -- Source: www.JSON.org payload received by Personalization. See Tracking request format on Episerver World for information about the payload contents.
- Response. Shows the widgets returned for the current request and the generated recommendations. This is available in JSON format, or as an indexed list of recommendations and the key data associated with each, such as recommendationId, refcode, and title.
- Track Info. Shows key tracking information after being processed by the system. For example, product page requests show more details related to the product, such as associated attributes and prices from the latest feed import.
You can view each tab as the default JSON format, or the raw format for a more condensed view. You can expand or collapse entries in the JSON view.