 Overview of B2B Commerce analytics
Optimizely B2B Commerce Analytics for eCommerce is a powerful tool for measuring and monitoring the success of your B2B eCommerce solution. It provides a set of dashboards allowing you to take a deeper look into your site, using data from your B2B Commerce site, Google Analytics and Google Tag Manager.
Accessing the Website
Once an account has been created, users receive an email to activate their account and create a password. After doing so, they can log into the B2B Commerce Analytics at https://analytics.insitecloud.net
Navigating Dashboards and Looks
Log in to the website to view the the B2B Commerce Analytics homepage and two primary navigation points on the left side and the upper right corner of the page. The left navigation provides access to the nine pre-configured dashboards, while the gear icon in the upper right provides access to settings.
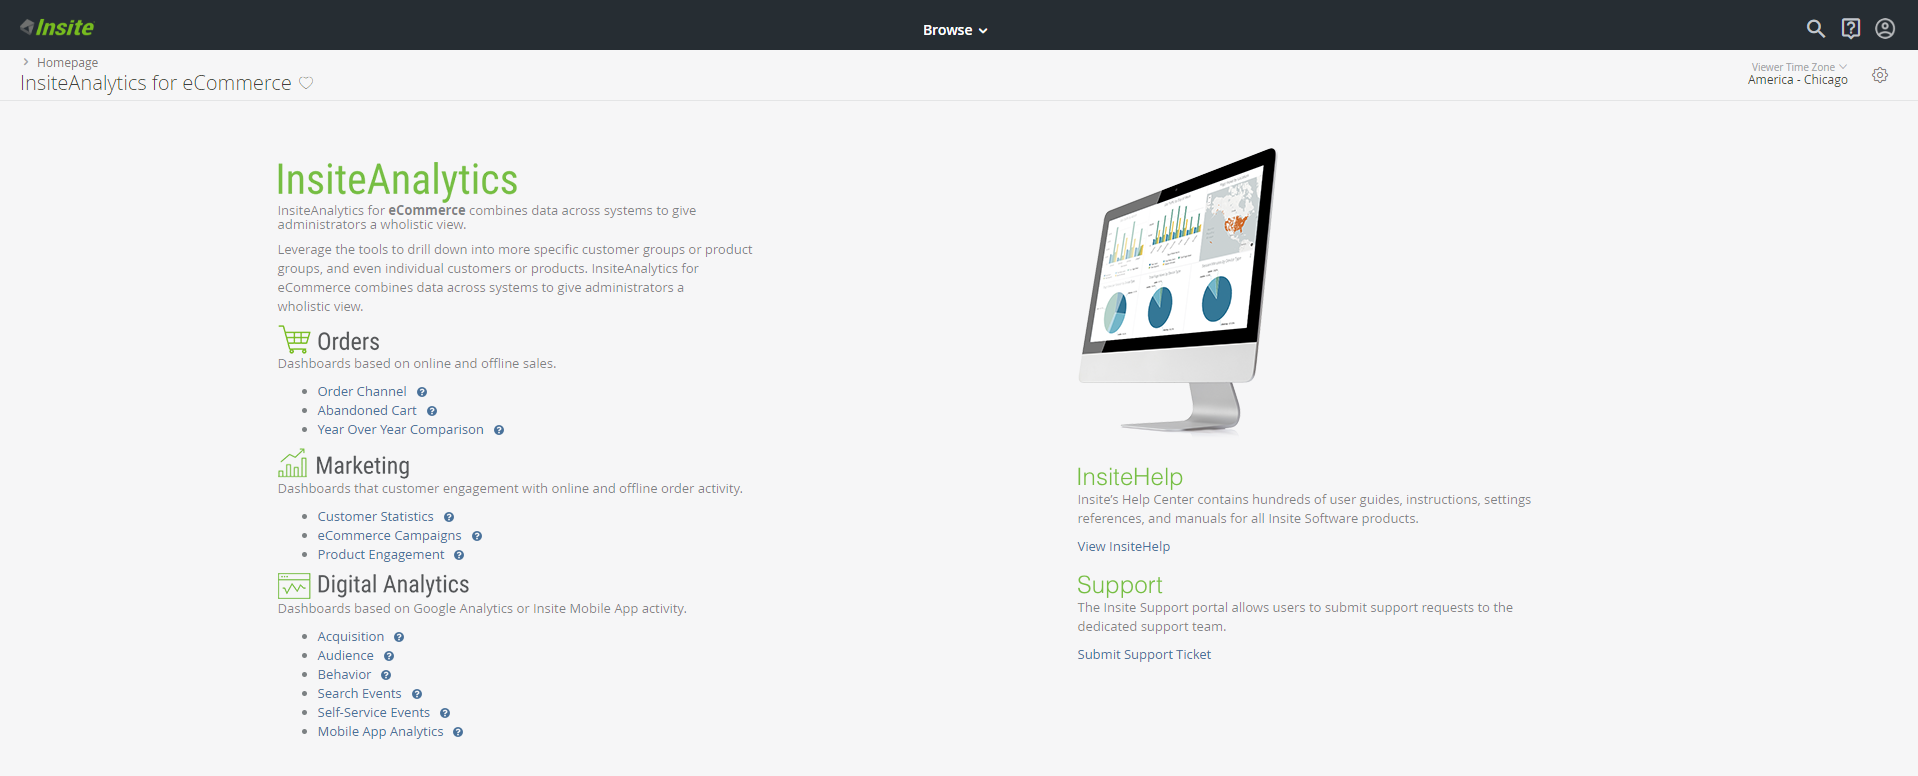
The dashboards are grouped into three folders: Orders, Marketing, and Site Analytics. To view a dashboard, select the folder, then select the desired dashboard.
Hover over the question mark icon to view a fly-out providing basic information about the respective dashboard: name, owner, and dates of creation and modification. This display is for informational purposes only.
The dashboards are defined as follows:
Orders
- Order Channel: Use this dashboard to take a look at combined online and offline sales, order counts and products counts. You can view by customer, date order channel, customer gropus, and products groups with drill-down capability
- Abandoned Cart: A holistic view on the analysis of abandoned carts and items not purchased after abandoning (either online or offline). Ability to isolate customer or product groups with drill-down capability.
- Year Over Year Comparison: Multi-year sales history comparing months across years and looks at sales dollars, order counts and product counts. View by customer, date, order source, customer groups, and product groups.
-
Online Orders: View online order activity, order counts and product counts. Users can view by customer, date, website, customer groups and product groups with drill-down capability. Does not account for any subsequent updates after order submission.
Marketing
- Customer Digital Engagement (Strategic Dashboard): Compares digitally engaged customers with offline-only customers. Digitally engaged customers are customers that have logged in to the website or placed an order online. Engagement is available for the previous 23 months, rolled up at the month level.
- Customer Statistics: Shows all customers by aggregating sales data from the last 12 months plus the prior two calendar years, split by order source and the last date ordered by source. Identifies Year-To-Date (YTD) and Year-over-Year (YOY) sales by comparing up to the same month/day from prior two years along with how many days in the past was their most recent order (either offline or online).
- eCommerce Campaigns: Shows all promotions set up in B2B Commerce and looks at the sales dollars and order counts attributed to the promotions.
- Product Engagement: Looks at products purchased repeatedly and identifies the specific customer and product combinations that may have fallen off the normal purchase frequency.
Site Analytics
- Acquisition: Displays where web traffic originates from (direct, organic, and so on) and shows any referral websites.
- Audience: Looks at when (day of week), from where (geo map) and how (desktop/mobile) people are reaching your website in a variety of visualizations.
- Behavior: Looks at searches conducted on your website and top pages viewed in a variety of visualizations.
- Search Events: Displays detailed searches conducted on your website, the most popular recently-used search terms and the number of times an item is searched and search result counts (including zero results). Also identifies autocorrected searches and lets you view the original keyed search along with the autocorrected search.
- Self-Service Events: Looks at self-service activity on your website with aggregation on how often self-service is used and the number of customers utilizing self-service in a variety of visualizations with drill-down capability.
- Mobile App Analytics: Looks at overall mobile app activity (search, self-service, transactions, views, and so on) in a variety of visualizations.
All dashboards are based on the current calendar year plus up to two prior calendar years, if applicable.
Viewing Dashboards
Select the desired dashboard to vies a pre-configured set of looks, or specific subsets of data. Each look provides a simple set of tools for printing or downloading data. To expand a look, click the three dots in the upper right corner and select View Original Look.
Additionally, if things have gotten a little out of control and you've been playing with options, try restoring the dashboard.
- To restore the dashboard, select the gear icon in the upper right.
- Select Clear Cache and Refresh.
- If you want to cancel this process, click Stop. Otherwise, your dashboard will be refreshed.
Filtering
Although the looks themselves are not configurable, you can manipulate the data using filters. Any changes to the data are preserved and presented when the user returns to the website. To manage filters, click Filters in the upper left above the dashboard.
From here, you can set options like date range, customer group (if applicable), and others as necessary. Close the filter panel to see your results. Return to the filter panel to reset your filters at any time.