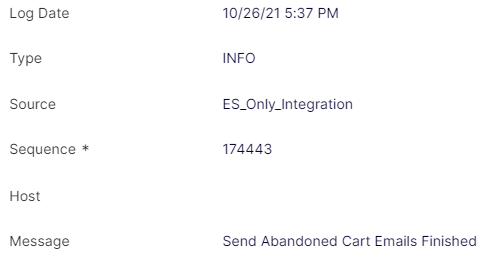
The Application Logs page is used to research application issues. The application log contains essential information, such as Log Date, Type, Source, Sequence, and Messaging. The application logs allow Support to track and identify exactly when an error occurred in B2B Commerce.
There are five types of Application Logs.
- Debug
- Fatal
- Error
- Info
- Warn
This article explains how to view application logs and also describes how logging takes place in containerized sites specifically.
View application logs
- To access the Application Logs, go to Admin Console > Administration > System > Application Logs.
- To view the details of any log entry, click the View icon (shaped like an eye) next to that entry.
Application logs for containerized sites
Optimizely updated logging for containerized sites to flow through Elasticsearch, including integration job logs and application logs. This offloads logging from the database in B2B Commerce and improves overall performance. This update automatically logs all debug messages as well, making it easier to perform research quickly if a problem occurs. If you recently upgraded, you may notice that logs appear to be missing after the new logs point to the Elasticsearch log and no longer point to the database log. Logs will appear again as new log entries are recorded. In addition, with this update, logs may take from 30 seconds to 1 minute to display in the Admin Console.
When displaying records, Elasticsearch can retrieve up to 10,000 records at one time for paged viewing. To view more logs, adjust the search parameters by using the Advanced Search function and set criteria for the search different from the defaults. Doing so will result in a different set of viewable data.